|
RadiantQ WPF Gantt
Chart Look and Feel
|   |
|
RadiantQ WPF Gantt
Chart Look and Feel
| |
We will walk you through the different settings available to fully customize the chart's look and feel.
For your reference, this is the default look of the chart before customization:
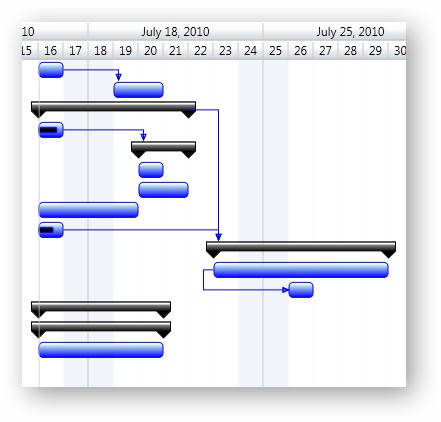
Default Look and Feel
The following sections will illustrate how to customize this look into something like the one shown below:
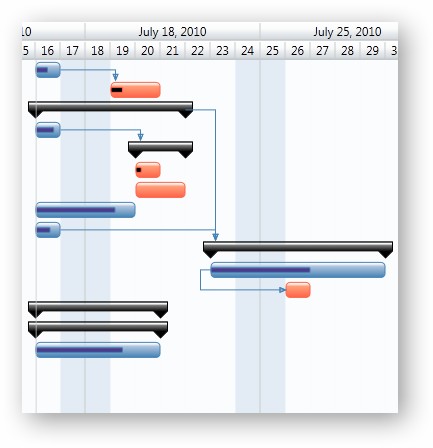
GanttChart with custom appearance settings (some bars with progress < 25% are in red)
There are also more topics that discuss more customization options like the following:
� RadiantQ 2009 - 2019. All Rights Reserved.