|
RadiantQ jQuery Gantt Package
How to hide the chart/table form the Gantt?
|   |
|
RadiantQ jQuery Gantt Package
How to hide the chart/table form the Gantt?
| |
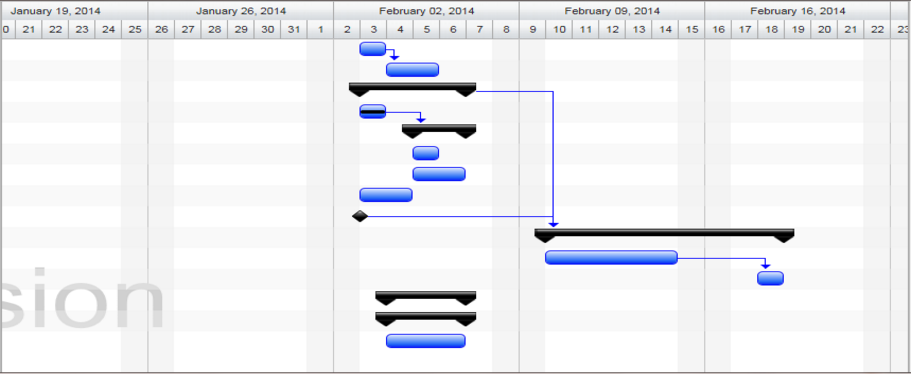
You can hide the chart form gantt by setting the option "ShowGanttChart" to false and its default value is true
|
$gantt_container.GanttControl({ ProjectStartDate: anchorTime, DataSource: self.jsonData, IDBinding: new RadiantQ.BindingOptions("ID"), NameBinding: new RadiantQ.BindingOptions("Name"), IndentLevelBinding: new RadiantQ.BindingOptions("IndentLevel"), StartTimeBinding: new RadiantQ.BindingOptions("StartTime"), EffortBinding: new RadiantQ.BindingOptions("Effort"), GanttTableOptions: { columns: columns, }, ShowGanttChart:false,// To hide the Grid GanttChartTemplateApplied: function (sender, args) { var $GanttChart = args.element; $GanttChart.GanttChart({ AnchorTime: anchorTime }); } }); |
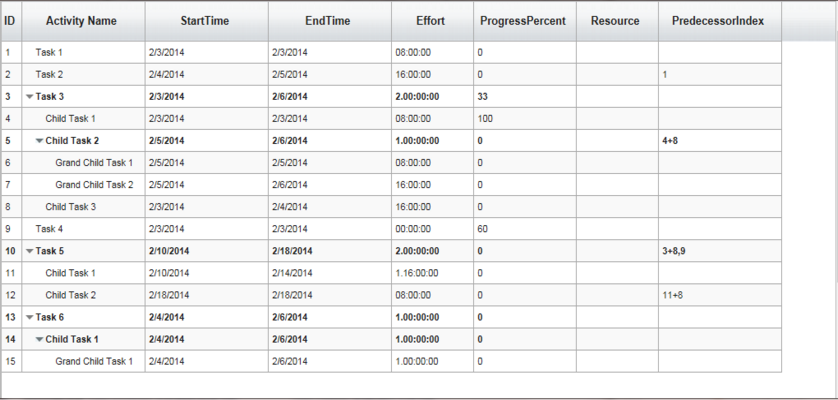
You can also hide the table set ""ShowGridTable" to false and its default value is true
|
$gantt_container.GanttControl({ ProjectStartDate: anchorTime, DataSource: self.jsonData, IDBinding: new RadiantQ.BindingOptions("ID"), NameBinding: new RadiantQ.BindingOptions("Name"), IndentLevelBinding: new RadiantQ.BindingOptions("IndentLevel"), StartTimeBinding: new RadiantQ.BindingOptions("StartTime"), EffortBinding: new RadiantQ.BindingOptions("Effort"), GanttTableOptions: { columns: columns, }, ShowGridTable:false,// To hide the Grid GanttChartTemplateApplied: function (sender, args) { var $GanttChart = args.element; $GanttChart.GanttChart({ AnchorTime: anchorTime }); } }); |
© RadiantQ 2022. All Rights Reserved.